 Port Moody by Bruce Fyfe

The real estate market in the Greater Vancouver Area has been a great place to invest or buy a home for a number of years. This summer, active home sellers brought a wider selection to the market and listed vs. sold properties are in equilibrium range. Sales declined rapidly in July 2011 compared to the previous month, but properties continue to be sold at a relatively swift pace, remaining only 41 days on average on the market.
If you are planning to buy or sell a property in one of the lovely Vancouver communities, these numbers may have little impact on your decision-making process. If you are aiming on a specific market, you will have to exercise your due diligence before you take the average Greater Vancouver Area market statistics into consideration. That’s why we analyzed another of the lovely Vancouver neighbourhoods, Port Moody.
Port Moody Real Estate Market
Year Over Year Price Index
for Port Moody July 2011
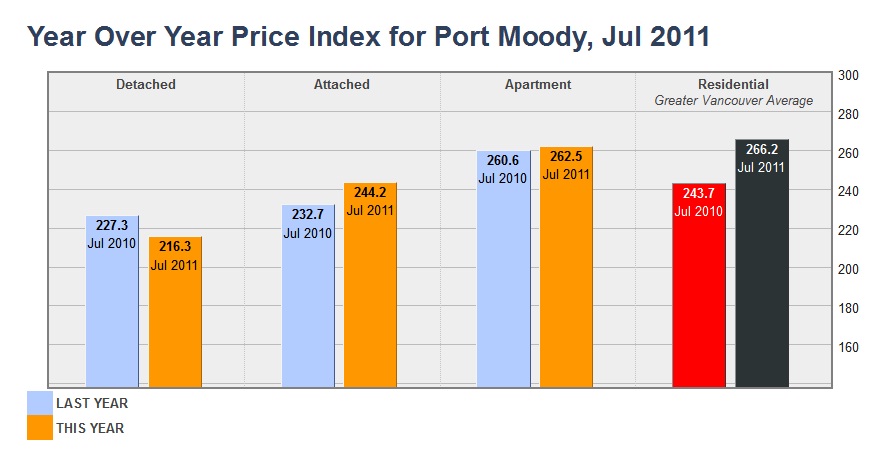
Buyers and sellers on the Port Moody real estate market have to cope with above-average prices of detached houses with a very volatile character. The average price for a benchmark detached home was $719,414 in July 2011, which was a decline by 4.9 per cent in a year-over-year comparison. Detached properties in Port Moody have recorded a jump in prices by 25.7 per cent since July 2006, but are now 6.1 per cent lower than in July 2008.
Attached housing recorded an average price of $409,158 and apartments sold for an average of $307,671 in July 2011. The structure of attached and condo properties in Port Moody is pretty uniform with low price gains and lower demand. Only several attached properties were sold in spite of about 110 active listings and about 50 new listings in July 2011. More than 20 apartments were sold in Port Moody in July 2011, which was an average result compared to the rest of the year. There are about 160 apartments for sale on the MLS system in Port Moody and about 50 were added during July 2011. Attached houses have risen in price by 4.9 per cent year-on-year, but the prices for apartments in Port Moody rose by less than one per cent year-on-year.
The Housing Price Index Trend Lines
Price Index for Port Moody
Three Year Trend
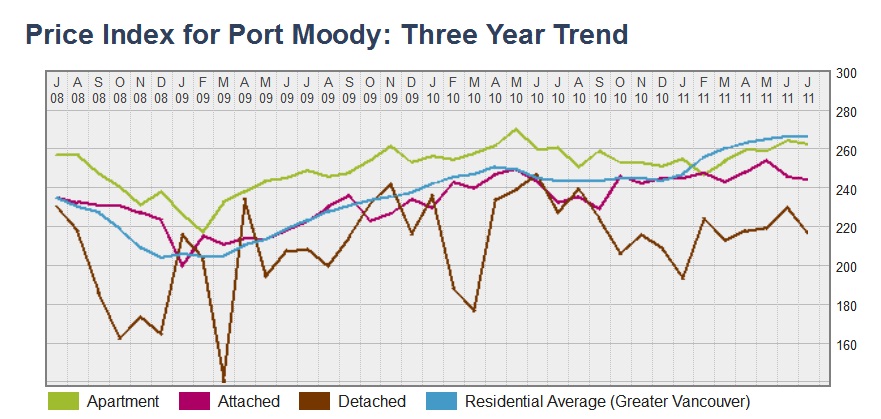
When we look at the Housing Price Index (HPI) trend lines, which represent the percentage rise in prices since 2001, when the index was set to 100, we see that the detached housing trend line has been seeing some deep valleys and sharp peaks throughout the past three years. After a steep decline and low period in fall 2008, the market rebounded for a slight period after Christmas, but plummeted to a record low of almost 140 HPI points. A drastic jump by almost 100 percentage points followed in April 2009, just to be corrected a month later to a level of about 200 HPI points. After an unsteady rise before Winter 2009 (reaching roughly 240 points), the index slumped again after Christmas to about 180 points and rebounded in April 2010. June 2010 recorded a peak value of almost 250 HPI points, but after that the index fell to the July number of 216.3 HPI points while oscillating heavily.
Apartment and attached properties’ trend lines did not experience such a diverse landscape. They held on to the Greater Vancouver average trend line closely, with only minor fluctuations. After the dip in fall 2008, Apartments and Attached houses both began a slow rise and ended at the level of 262.5 and 244.2 respectively.
All data and graphs courtesy of the Real Estate Board of Greater Vancouver.