According to the Real Estate Board of Greater Vancouver, home sale activity in Vancouver’s real estate market is improving but remains below historical averages.
The drop came as REBGV reported a drop in sales of 18.3 per cent, at 2,347 sales, in March compared with the 2,874 sales recorded in the same period a year ago. Compared to February 2013, REBGV reported a 30.6 per cent increase in last month’s sales. The sales last month were the second lowest March total in Greater Vancouver since 2001 and 30.2 pre cent below the ten-year sales average for the month.
While home sales were below what’s typical for March, we are seeing more balance between the number of sales and listings on the market in the last two months, which is having a stabilizing impact on home prices
said Sandra Wyant, president of the Vancouver board.
The ratio of sales to active listings also improved to 15.2 per cent in Greater Vancouver, a 3 per cent increase from last month — the first time it has been above 15 per cent since May 2012.
 Vancouver by Peggy2012CREATIVELENZ

In March, new listings for detached, attached, and apartment properties totalled 4,839 — a 17.2 per cent fall compared to last year’s results, when new listings amounted to 5,843 units, and a 0.1 per cent increase from the 4,833 new listings recorded in February. February’s new listings count was 4 per cent higher than the region’s ten-year new listing average for the month.
The total number of properties currently listed for sale on the Greater Vancouver MLS® amounted to 15,460 — a 1.5 per cent increase compared to the same time last year, and a 4.5 per cent increase compared to February 2013.
The MLS® Home Price Index composite benchmark price for all residential properties in Greater Vancouver is currently $593,100. This represents a decline of 3.9 per cent compared to this time last year and an increase of 0.9 per cent compared to January 2013.
• Detached property sales on the MLS® (with 933 units) experienced a 21.1 per cent decrease compared to March 2012 (with 1,183 units), and a massive 48 per cent decline compared to March 2011 (with 1,795 units). The benchmark price has fallen by 5 per cent compared to last year’s benchmark price of $901,500.
• Apartment property sales (totalling 982 units) experienced a decline of 17.5 per cent compared to March 2012 (with 1,191 units) and 39.5 per cent compared to March 2011 (with 1,622 units). The benchmark price for an apartment property in Greater Vancouver declined 3.3 per cent from March 2012 to $362,100.
• Attached property sales (totalling 432 units) underwent a 13.6 per cent decline compared to March 2012 (with 500 units), and a 34.8 per cent decrease compared to March 2011 (with 663 units). The benchmark price of an attached unit decreased by 2.5 per cent between February 2012 and 2013 to $454,300.
 Vancouver Condos by Badcomputer

Richmond, Vancouver East, and Vancouver West Sales Statistics Compared
In the second part of this month’s analysis, we’ll focus on the situation in the Vancouver East, Vancouver West, and Richmond real estate markets.
Vancouver East sales activity for detached properties in February increased by 22.1 per cent (from 77 to 94 units). The situation improved by 38.1 per cent (from 21 to 29 units) in the attached properties market and by 47.8 per cent in the apartments sector (from 67 to 99 units) compared to last month’s data.
Vancouver West data show a new trend in detached properties, with a 45.2 per cent increase (from 104 to 151 units) compared to last month. The situation for attached properties with a 52.6 per cent increase (from 38 to 58 units) remains very stable, and apartments experienced a 28.1 per cent increase compared to February 2013 (from 253 to 324 units).
Richmond experienced a zero increase in the detached properties market (89 units) compared to last month´s data. We also saw an increase of 48 per cent in the attached properties market (from 50 to 74 units) and a 46.3 per cent increase in the apartments sector (from 80 to 117 units) compared to the month before.
Compared year-over-year, Vancouver’s overall sales activity dropped by 26.1 per cent in detached, 15.7 per cent in attached, and 19.2 per cent in apartment properties in the last quarter.
New Listings in Vancouver East, Vancouver West, and Richmond
Vancouver West experienced a 13.2 per cent decrease in the listings activity of detached houses (from 317 to 275 units) compared to last month’s decimated listings. Drops for attached properties were higher, with a 21.9 per cent fall (from 105 to 82 units), and listed apartments fell by 4.6 per cent (from 646 to 616 units).
Vancouver East recorded a 5 per cent drop (from 219 to 208 units) for detached properties, a 21.9 per cent fall in attached properties (from 73 to 57 units), and a 24.8 per cent increase in apartments compared to the end of last month’s results (from 157 to 196 units).
The situation on the Richmond real estate market was less radical. Apartment listings experienced an 2.5 per cent drop (from 240 to 234 units) compared to last month’s results. Listings of detached properties decreased by 8.2 per cent (from 245 to 225 units), and there was a 5.3 per cent drop (from 133 to 126 units) in attached properties compared to March 2012.
Overall, the Vancouver listings of detached properties decreased by 1.9 per cent, and there was a 5.6 per cent increase in attached properties and an 0.2 per cent increase in apartments.
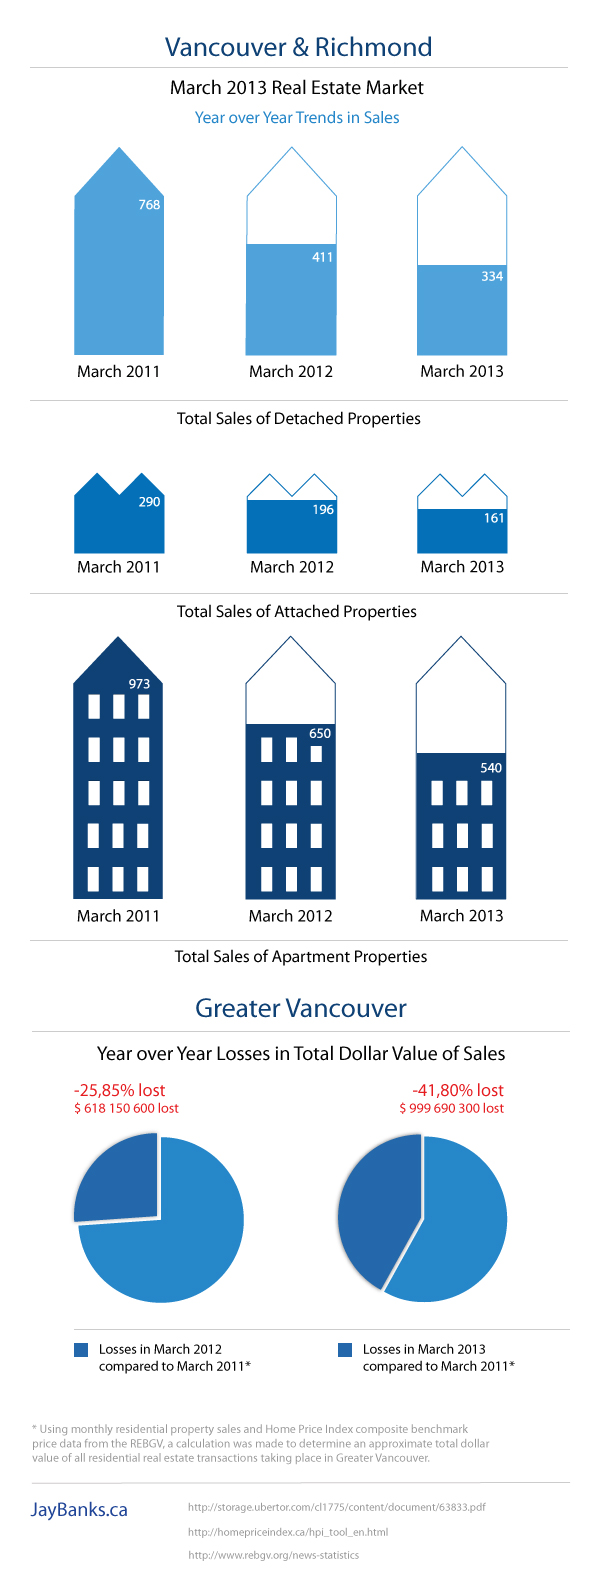
Year over Year Trends in Sales
In the first part of our infographic we illustrate the total sales statistics of detached, attached and apartment properties in Vancouver and Richmond for March.
We continue with the year over year losses in total dollar value of sales of Greater Vancouver, where the loss reached 41.80 per cent for March 2013 compared to March 2011, while the loss a year ago was 25.85 per cent compared to March 2011.
[…] Vancouver Real Estate Market Shift Slightly in March 2013 – Jay BanksAccording to the REBGV, home sale activity in Vancouver's real estate market is improving but remains below historical averages.jaybanks.ca/…/vancouver-real-estate-market-report-march-201… […]