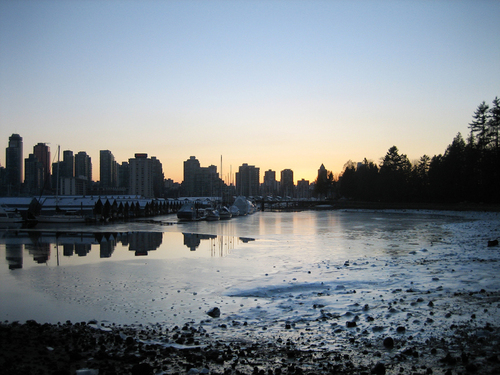
 Vancouver Winter Skyline by Sandip Chatterjee
A year of dropping home sale totals, boringly stable home listing activity and moderate declines in home prices, that was 2012 on the Vancouver Real Estate Market.
Eugen Klein, REBGV president commented on the development:
For much of 2012 we saw a collective hesitation on the part of buyers and sellers in the Greater Vancouver housing market. This behaviour was reflected in lower than average home sale activity and modest fluctuations in home prices.
The REBGV reported the total sales of detached, attached and apartment properties in 2012 reached 25,032, a 22.7 per cent drop compared to the 32,387 sales recorded in 2011, and an 18.2 per cent fall from the 30,595 residential sales from two years ago. Last year’s home sale totalled 25.7 per cent below the ten-year average for annual Multiple Listing Service® (MLS®) sales in the region.
The MLS HPI® composite benchmark price for all residential properties in Greater Vancouver continues the declining trend with $590,800 in December. Compared to this time last year, the benchmark price fell by 2.3 per cent and when compared to the peak benchmark index of $625,100 in May, there’s been a 5.8 per cent continuous decline as well. The composite benchmark price declined when compared with the previous month as well, when the value reached $596,900.
The number of residential properties listed for sale on the MLS® in Greater Vancouver fell 2 per cent in 2012 to 58,379 compared to the 59,539 accounted properties in 2011. Last year’s total represents a 0.6 per cent increase compared to the 58,009 residential properties listed two years ago. Last year’s listing total was 6.1 per cent above the ten-year average for annual MLS® property listings in the Greater Vancouver region.
New listings for detached, attached, and apartment properties fell to 1.380 — a 15.3 per cent drop in the growth compared to last year’s results, when new listings amounted to 1,629 units. Compared to November this year, with 2,758 homes added to the MLS® in Greater Vancouver, December numbers fell by incredible 50 per cent.
Residential property sales in Greater Vancouver amounted to 1,142 in December 2012, a drop of 31.1 per cent compared to 1,658 sales from December 2011 and representing a number lowered by 32.3 per cent when compared to November 2012 with 1,686 home sales.
December sales were 38.4 per cent below the 10-year December sales average of 1,855.
- Detached property sales on the MLS® (425 units) experienced a substantial 32.5 per cent fall compared to December 2011 (630) and even bigger 44.7 per cent decline compared to December 2010 (769 units). The benchmark price fell by 6.5 per cent since the peak benchmark in May to $904,200.
- Apartment property sales (504) declined by 34.9 per cent compared to December 2011 (774) and 37.9 per cent compared to December 2010 (811). Since reaching a peak in May, the benchmark price for an apartment property in Greater Vancouver has declined 12.8 per cent to $361,200.
- Attached property sales (213 units) a 16.1 per cent decline compared to December 2011 (254 units), and 33.2 per cent decrease compared to December 2010 (319 units). Since reaching a peak in April, the benchmark price for an attached property in Greater Vancouver has declined 4.4 per cent to $450,900.
Richmond, Vancouver East and Vancouver West Stats Compared
 East Vancouver by Carolyn Coles
In the second part of this month’s analysis, we’ll focus on the situation on Vancouver East, West and Richmond markets. The last month as well as the last quarter of the year ended up in deep recession of sales activity in all three markets. East Vancouver’s sales activity in December dropped by 40.7 per cent in detached (from 91 to 54), 51.4 in attached (from 35 to 17) and by 23.2 per cent in apartments (from 69 to 53) when compared to last month. West Vancouver data show the persisting fall in sales of attached properties with 25 per cent drop (from 40 to 30) when compared to last moth. The similar destiny awaited detached properties with 36.4 per cent drop (from 77 to 49) and apartments with 35.3 per cent decrease (from 241 to 156) when compared to November 2012. Richmond didn’t end up any better than both West and East Vancouver, however, it experienced somewhat milder drop in sales on attached properties market, where it fell by 20 per cent (from 50 to 40). It also experienced downfall of 42.1 per cent on detached properties market (from 76 to 44) and 33.3 per cent on the apartments market (from 81 to 54) when compared to the month before.
Vancouver’s overall sales activity in last quarter when compared to the same time last year dropped by 27 per cent in detached, 20.6 in attached and 24.7 per cent in apartment properties.
Listings in Vancouver also experienced some major downfall. Vancouver West experienced the 39.6 per cent drop in listing activity of detached houses (from 159 to 96 units), even more radical were the falls of attached properties with 62.7 per cent decline (from 67 to 25 units) and apartments with 60.5 per cent fall (from 387 to 153 units) compared to last month’s already low listings. Vancouver East read 44.1 per cent decrease (from 111 to 62 units) for detached properties, 73.1 per cent plunge in attached (from 52 to 14 units) and exactly 50 per cent less listings of apartments when compared to the end of last month’ results (from 102 to 51 units). The situation on the Richmond market was much less radical, especially on the apartments market which experienced 35.2 per cent drop (from 145 to 94) when compared to Vancouver East and West markets. Listings of detached properties decreased by 41 per cent (from 138 to 81) and by 51.6 per cent (from 93 to 56) on the attached properties market, when compared to November 2012. Over all, the Vancouver listings of detached properties fell by 47.1 per cent, 54.1 per cent in attached and 50.7 in apartment real estate properties.
Benchmark prices in both East and West Vancouver haven’t been very active in December. The West Vancouver benchmark price for residential/composite currently marks $780,100, single family detached at $2,004,000, townhouses at $663,600 and apartments reached $463,700. The East Vancouver benchmark prices for December are as follows: residential/composite currently marks $600,200, single family detached at $829,200, townhouses at $512,600 and apartments reached $303,400. Richmond showed the following numbers: residential/composite currently marks $561,300, single family detached is at $938,100, townhouses at $488,100 and apartments reached the benchmark price of $334,000.
B.C. Assessment released 2013 property assessments showing values decreasing for the first time in many years, most notably in areas including the west side of Vancouver,Pemberton, Whistler, Bowen Island and the Sunshine Coast.
Year over Year Trends in Sales
In the first part of our infographic we illustrate the total sales statistics of detached, attached and apartment properties in Vancouver and Richmond for December.
We continue with the year over year losses in total dollar value of sales of Greater Vancouver, where the greatest loss reached 47.54 per cent for September- December 2012 in comparison with September-December 2009.


