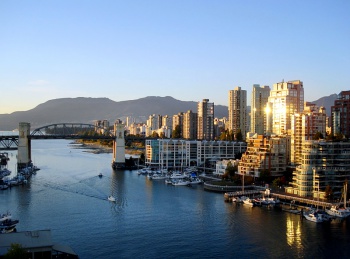
 Downtown Vancouver by JamesZ Flickr
The total number of homes listed for sale on the region’s MLS® reached 17,370 increasing by 12 per cent compared to last year’s results. This also represents 5.3 per cent fall in activity compared to September 2012.
Sandra Wyant, REBGV president-elect, commented on the October market situation: “Buyer demand increased slightly in October compared to the previous few months. Overall conditions in today’s market remain in favour of buyers, with low interest rates, more choice, and less time pressure in terms of decision-making. This translates into a calmer atmosphere for those looking to buy a home and it places more onus on sellers to ensure their homes are priced to compete in today’s marketplace.”
Greater Vancouver Area
October sales were 28.5 per cent below the ten-year October sales average of 2,700. Hence we can safely conclude that similar to September this year, the sales activity in October 2012 was deeply below historical averages in the Greater Vancouver Area. Residential property sales of detached, attached, and apartment properties reached 1,931 in October — a 16.7 per cent decline compared to the 2,317 sales in October 2011 and an 27.4 per cent surprising increase compared to the 1,516 sales in September 2012.
New listings for detached, attached, and apartment properties totaled 4,323, representing a 1.2 per cent fall in the growth compared to October 2011, when new listings amounted to 4,374. This represents the 18.8 per cent decrease compared to September this year, when 5,321 homes were added to the MLS® in Greater Vancouver.
The MLS HPI® composite benchmark price for all residential properties in Greater Vancouver reached $603,800 in October. This represents a decline of 0.8 per cent compared to this time last year and a decline of 3.4 per cent compared to the peak benchmark index of $625,100 in May.
- Detached property sales on the MLS® (790 units) experienced a massive 18.9 per cent fall compared to October 2011 and another 19.1 per cent decline compared to October 2010 (976 units). The benchmark price fell by 4.1 per cent from October 2011 to $927,500 , following the trend since the peak benchmark in May. Since hitting a record high in April, the benchmark price of a detached home on the Westside of Vancouver has declined 8.6 per cent, while detached homes in Richmond and West Vancouver have seen declines of 6 per cent over the same time period.
- Apartment property sales (803) declined 16.2 per cent compared to October 2011 (958) and 18.4 per cent compared to October 2010 (984) the benchmark price declined by 2.9 per cent compared to the October 2011 stats, currently falling to $368,800.
- Attached property sales (338 units) experienced a milder (especially compared to September) 11.5 per cent decline compared to October 2011 (382 units), and once again an almost identical 10.3 per cent decrease compared to October 2010 (377 units). The benchmark price fell by 2.9 per cent since the peak in April to $457,700 and remained relatively unchanged compared from last month’s value.
City of Vancouver

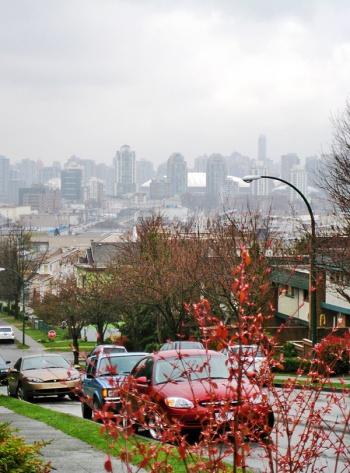
View of the city from East Van
by Carolyn Coles
If we zoom from the Greater Vancouver Area to the City of Vancouver we can see that both Westside and Eastside experienced quite considerable changes in the amount of the sold units. Both numbers declined compared to the previous year, mostly as a result of higher saturation of the market this year. Interestingly, Eastside market experienced the 12.19% increase in the same category compared to previous month, as well as Westside market, which increased by 25.45%.
If you’re interested in the townhouse, October wasn’t your month, since the average price increased by the 16.6% up to $792,081. (especially in the Westside the price reached staggering $942,383). Detached and Condo apartment prices remained more or less stable. (Detached: +6.79%, Condo: -7.89% compared to September.) It looks like the deadlock on the condo market might last for a while after all. We’ll monitor the situation and keep you updated.
Concerning listed units, we see quite the negative development on both Eastside and Westside markets compared to the previous month. Eastside dropped by 19%, landing on 439 listed units, Westside traditionally with higher numbers listed 1008 units, with milder 11.89% decline.
The market remained quite active when compared to the previous month, however, if we compare it to the situation on the market same time previous year, we don’t see almost any change in the behaviour, leaving all the current theories about the improvements on the market empty handed.
Let’s leave the current situation be for a while and look at how the Price Waterhouse Coopers and Urban Land Institute see the 2013 trends on the Vancouver real estate market. Since the 2012 situation on general markets improved and the economy is keeping the pace in the fourth quarter with GDP forecast for 2013 reaching 3.7 per cent, we can expect the stronger buyers pool. The increase in the employment will probably reach values outreaching ten-year average, leaving even the last remains of the crisis in dust. The Consumer spending will be, according to the PwC and ULI, one of the crucial factors influencing the markets. All these information create a very positive picture for the 2013 Vancouver real estate market.
Although the initial data were supportive to the Vancouver real estate market, it seems all three, development, home-building and investment prospects are going to drop.
Less high-end product is moving in Greater Vancouver. Sellers are dropping prices. Lower-priced product continues to move.
It looks like particularly industrial is looking out in the buy sector.

