Delta South of Vancouver
by Iwona Erskine Kellie
According to the stats released by the Real Estate Board of Greater Vancouver, the real estate market in Vancouver started to shift toward a buyer’s market in the past three months. Before that, demand and supply were in an equilibrium state, but listing activity started to rise and has exceeded the ten-year average every month since the beginning of 2011. Moreover, sales have been the third lowest for August in the last ten years. Nevertheless, the real estate market in Vancouver is still balanced with a slow, stable price growth. These conditions suggest that Vancouver real estate should be a great investment, but as Rosario Setticasi, REBGV president, said, “It’s important for people entering the market to understand that activity can differ significantly depending on the area and property type.” That’s why we bring you an overview of another Metro Vancouver area — the South Delta real estate market.

Year Over Year Price Index for
South Delta - August 2011
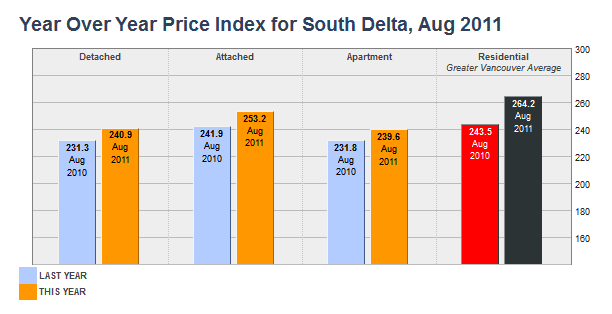
South Delta, just south of Richmond, has a pretty lively real estate market. The listed properties versus sold properties graph shows that there were about fifty detached houses, eleven attached houses, and about eighteen apartments sold in the neighbourhood in August 2011. The average price of a detached property was $737,140. A benchmark attached house cost $472,777, and apartments sold for an average price of $367,928.
The Housing Price Index measures how much prices of different housing types appreciate over time. The index was set to 100 in 2001, so it measures the current price distance for a typical, constant-quality property between now and 2001. Detached housing hit 240.9 points in August 2001, down by 4.1 points month-over-month, but up by 9.6 HPI points in a year-over-year comparison. Attached housing followed a similar pattern, reaching 253.2 points in August 2011, down from July’s 256.3 points. Year-on-year, the index for attached houses rose by 11.3 points. Apartments in South Delta reached 239.6 HPI points. This was down 10 points from the previous month, but up 7.8 points in a year-over-year comparison. The Greater Vancouver Residential Average housing price index was 264.2 points for August 2011.

Price Index for South Delta
Three Year Trend
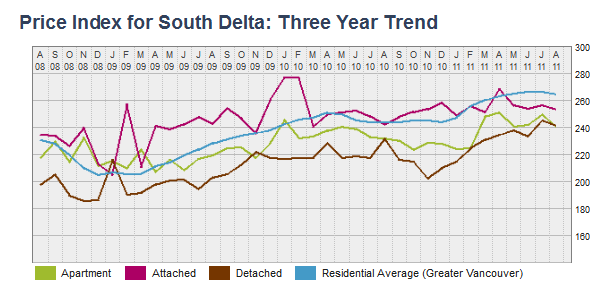
When we look at the price index trend line, we can see that each trend line has a strong seesaw pattern, but that the global ups and down follow the Greater Vancouver residential average. Attached houses experienced two big price spikes in the past, reaching almost 260 points in February 2009 (the average was below 210 points then) and another spike that held the price index at almost 280 points from January to February 2010 (residential average was 240 points then). In 2011, apartments and attached houses jumped by about 20 points in February and March, respectively. They both recovered in April 2011, reaching the aforementioned August 2011 numbers. Detached housing has been on a massive gradual hike from the November 2010 low of almost 200 HPI points. The price has been growing since, with two small falls, including one in August 2011.


