 New Westminster HPI

If you’re considering buying or selling a home in one of the Greater Vancouver areas, it is always wise to research wider market trends and familiarize yourself with the market conditions of your local or target area. Following our report on the real estate statistics, released by the Real Estate Board of Greater Vancouver (REBGV) for Richmond, let’s have a closer look at the New Westminster real estate numbers.
The average residential Greater Vancouver Housing Price Index (HPI), which measures the percentage change in prices for a typical, constant quality real estate property over time, was up 2.1 per cent over the previous year in January 2011. This supports the REBGV’s view that the market stays in a balanced condition. On the other hand, detached houses in New Westminster declined by 5.4 per cent in January 2011 in a year-over-year comparison. They decreased considerably compared to the previous month, going down from a HPI of 247.1 to 233.9 points. The HPI points represent the percentage change of prices over the year 2001, when the HPI was set to 100. Apartment prices in New Westminster recorded a year-over-year rise of 5.4, with only a slight increase from December 2010 to January 2011. Other types of housing are not included in the statistics.
In the long run, detached housing prices in New Westminster increased by just 16.9 per cent over five years, which is far less than the residential Greater Vancouver average price jump of 37.4 per cent over the same period. Moreover, apartment prices in the New Westminster neighbourhood experienced a larger upward movement, with the HPI rising by 42.2 per cent over five years.
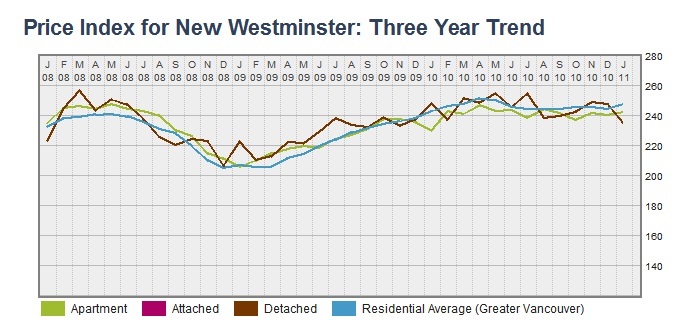
When looking at the three-year trend line, we observe that both detached and apartment house prices in New Westminster have been roughly following the average residential Greater Vancouver price trend line. Detached house prices have been showing a great deal of volatility since 2008, unlike the smooth apartment price index line. Detached house prices were on their peak in March 2008, when they started to plummet as the real estate market crumbled. They experienced a single spike in the middle of the crisis in January 2009 and after adjusting, began a slow upward trend until July 2010, when they fell considerably. Following a steady rise from September to December 2010, they then moderated again in January 2011. The apartment housing price index line has been clutching tightly to the average residential Greater Vancouver price index line. It has followed this line since 2008 with one exception, in January 2010, when the prices dropped sharply but adjusted quickly. The apartment prices in New Westminster were slightly higher than the average for Greater Vancouver throughout most of 2008 and 2009, but have stayed below the average since the drop in January 2010.
Hi there,
Just a thought – Price index and housing averages don’t have much to do with market trends.
For example:
Housing prices are
$100,000
$100,000
$100,000
$100,000
$100,000
$100,000
$100,000
$100,000
$100,000
$100,000
$900,000
Which is a more relevant number?
Average: $190,000
Median: $100,000
I’d say that your clients would want to know the median price. Just an idea :)